
The development of in-situ tensile testing in the GeminiSEM 500 FEG SEM was carried out as part of T. Dessolier’s doctoral thesis at the SIMaP laboratory, titled “Heterogeneities in the Plastic Deformation of Magnesium Alloys under Superplastic Conditions.”
The objective was to develop an in situ hot tensile test within a scanning electron microscope (SEM) in order to measure strain fields at the microstructural scale using digital image correlation methods. Based on the analysis of these strain fields, the stated goal is to distinguish between intragranular strain associated with dislocation slip and intergranular strain associated with slip at grain boundaries.
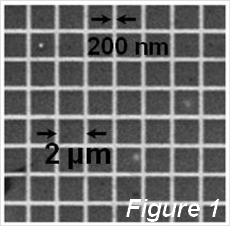
Significant experimental advancements have made it possible to conduct tensile tests at temperatures up to 350°C on AZ31 alloy specimens within the SEM environment while maintaining temperature control to within ±5°C and controlling the strain rate. Note that the tests must be performed in VP mode, i.e., Variable Pressure, with a vacuum degraded by a few Pa to prevent magnesium vaporization in the SEM chamber (low saturated vapor pressure of Mg). This requirement to work in VP mode for hot tests imposes additional constraints in terms of imaging, since the resolution is not as good as in high-vacuum mode. Image quality is crucial for the analysis of strain fields via digital image correlation. The presence of micro-markers compatible with the experimental conditions (temperature-resistant, visible in electron imaging, and fine enough to allow intragranular measurements) is necessary to enable image correlation. Platinum microgrids (pitch between 1 and 2 microns) fabricated either by electron beam microlithography or by FIB are deposited on the surface of the micro-tensile specimens to create the local contrast required for field measurements via image correlation; see the example of a Pt microgrid fabricated by FIB deposition (Figure 1).
The region of interest is systematically characterized using EBSD to determine (i) the position of the grain boundaries and (ii) information on the crystalline orientation of the grains. The analysis then requires the development of computational tools to extract a variety of information:
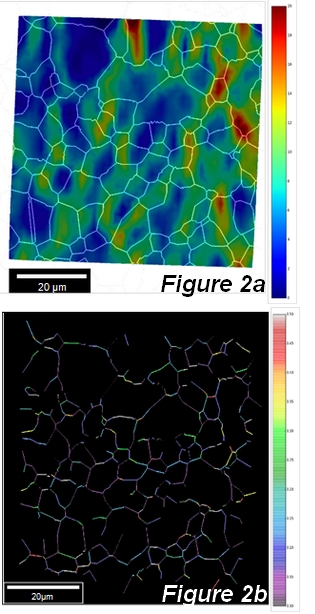
- strain fields (see Figure 2a: Strain field of the strain component in the tensile direction (horizontal direction) after 10% macroscopic strain at 300°C at a strain rate of 5 × 10⁻⁴ s⁻¹. The color code represents the local strain level (in %),
- distribution of local strains,
- displacement maps at grain boundaries (see Figure 2b: Displacement map at grain boundaries after 50% macroscopic strain at 300°C at a strain rate of 5 × 10⁻⁴ s⁻¹. The color code represents the intensity of slip at grain boundaries),
- correlation between intragranular strain and crystal orientation, between local strain and distance from grain boundaries, etc.